
Monitor Sales by Region, Channel and Month
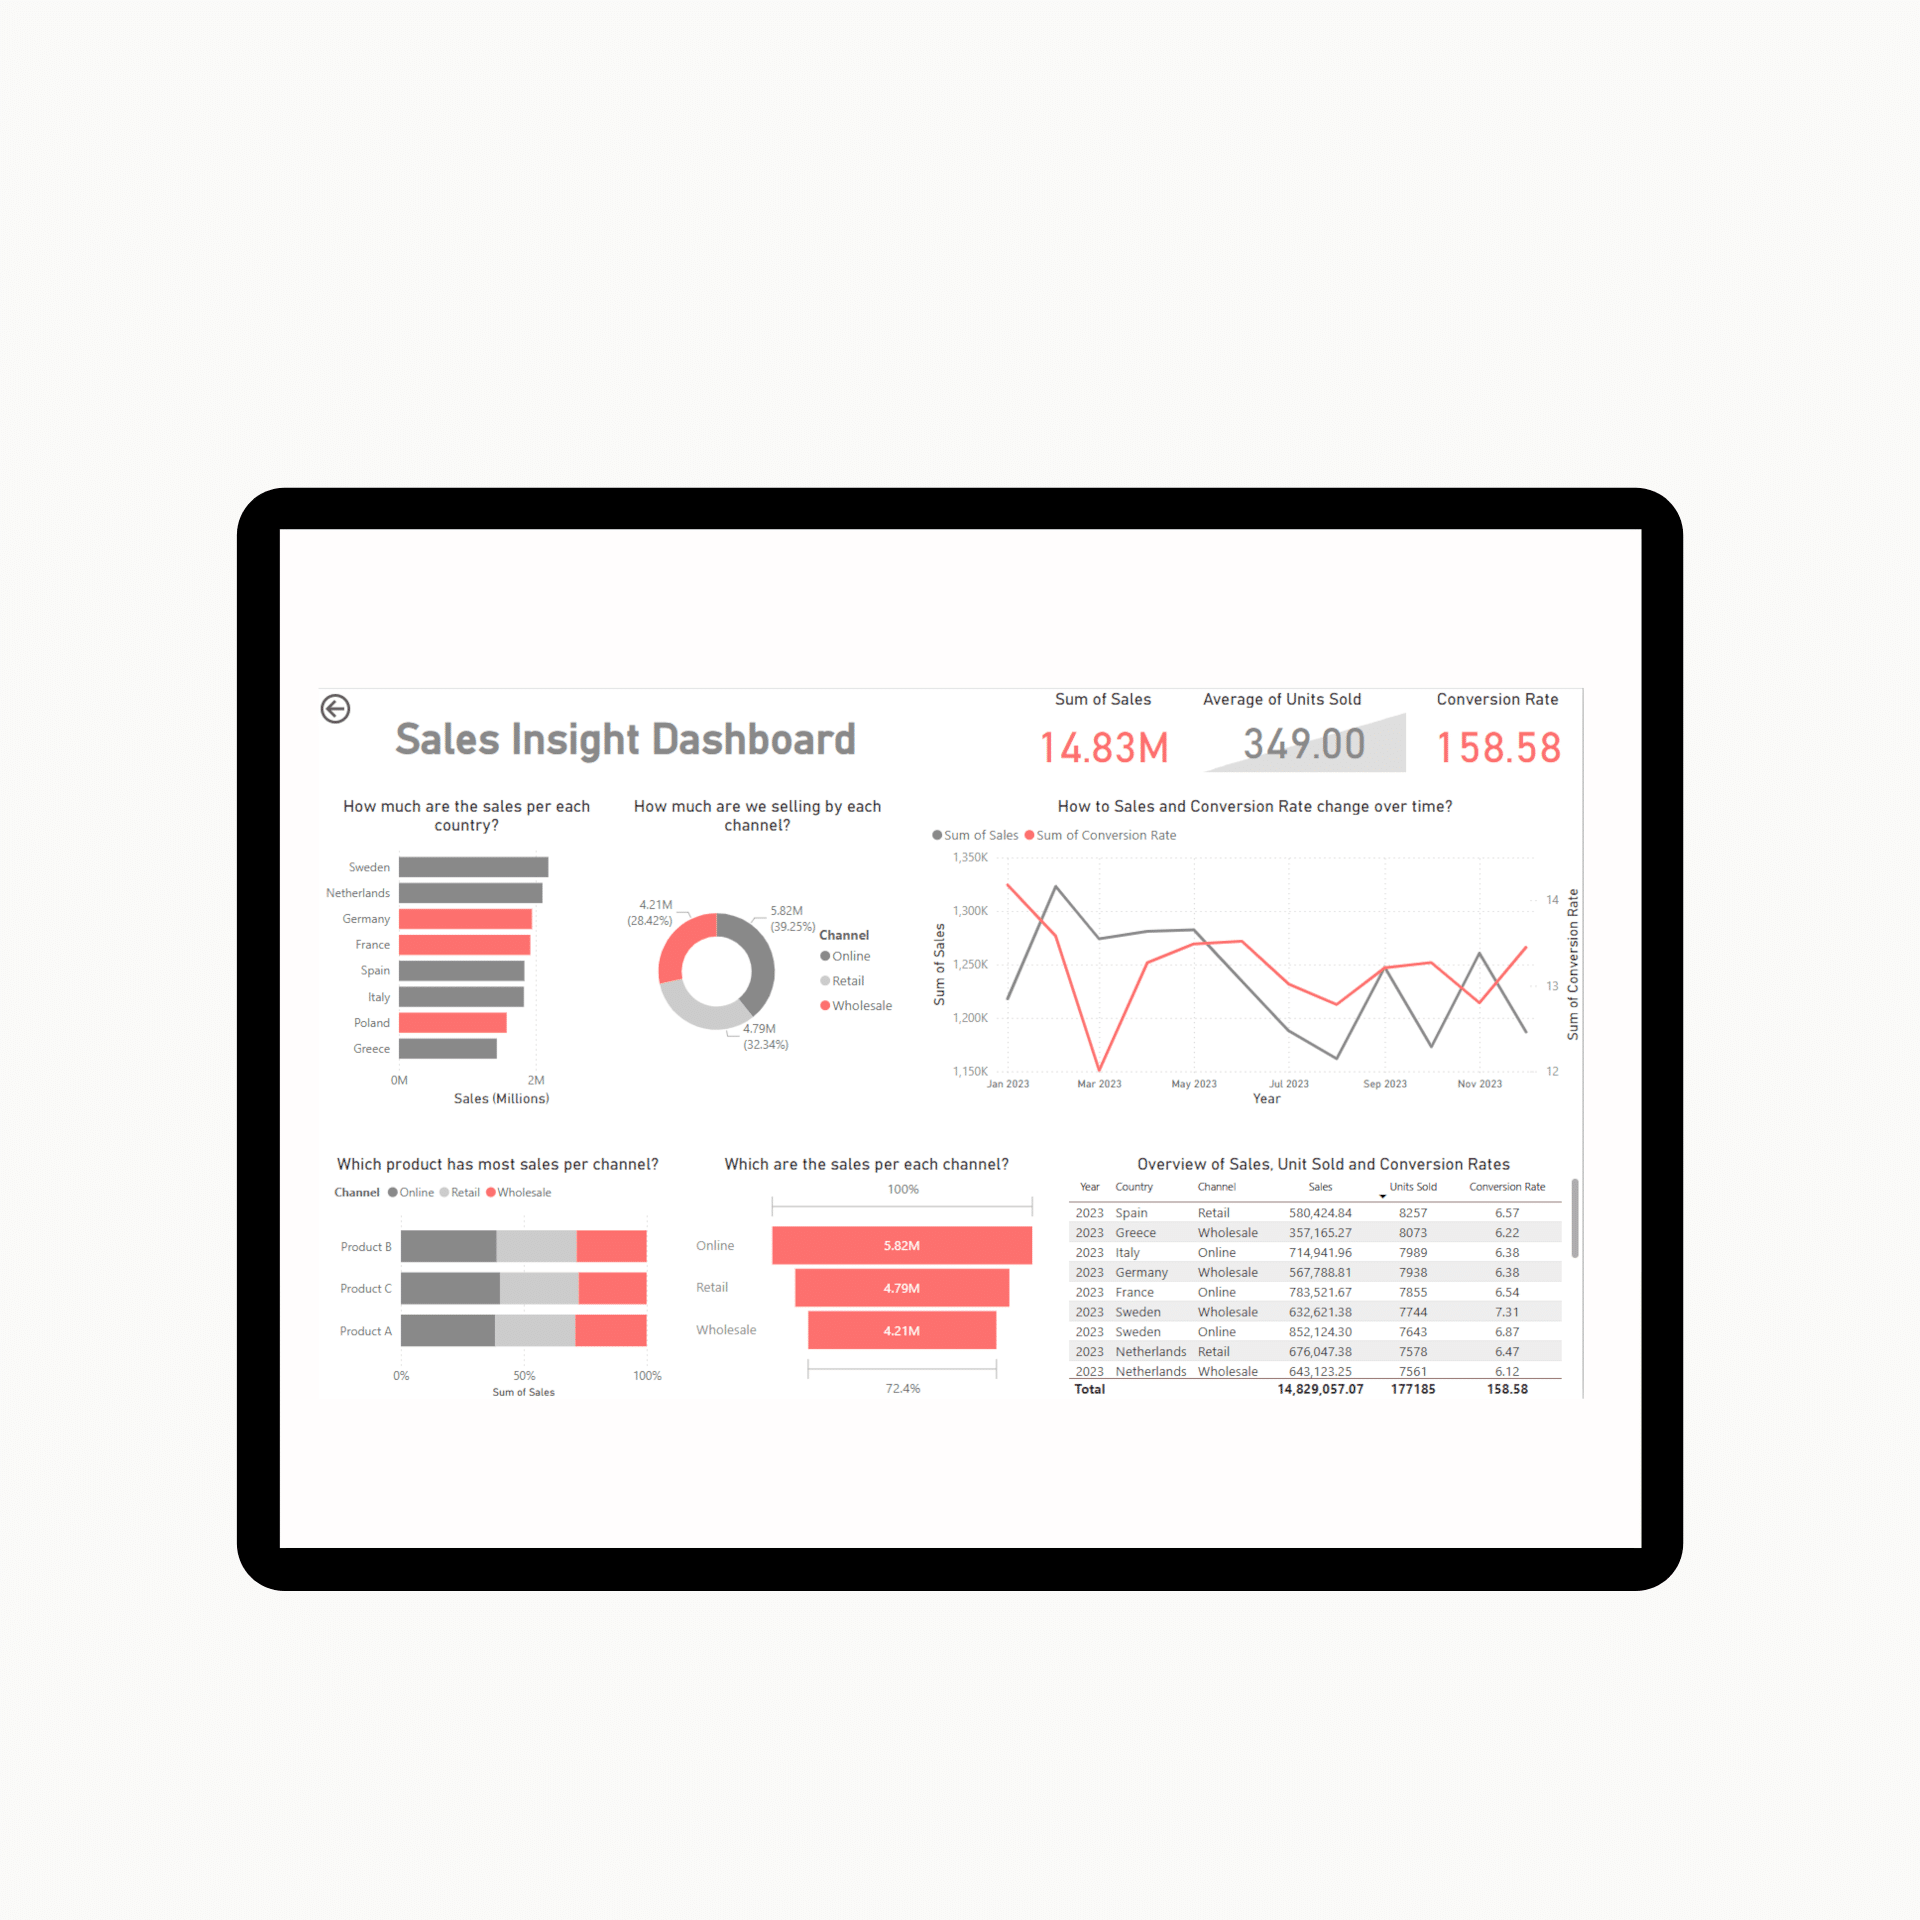
Sales Dashboard Power BI is a pre-built template that shows your sales performance on one interactive page: total sales, conversion rate, sales by country, sales by channel and monthly trends. It’s made for sales teams, analysts, consultants and small business owners who want clear sales reporting in Power BI without building a dashboard from scratch. No DAX or design skills are needed.
What the sales dashboard shows?
- Executive overview: KPI cards for total sales, average units sold and conversion rate, so you see performance in seconds.
- Sales by region: a bar chart ranking each country’s contribution, so top markets stand out right away.
- Sales by channel: donut and stacked bar charts comparing Online, Retail and Wholesale, including which products sell best in each channel.
- Monthly sales trends: a line chart of sales and conversion rate over time, to spot peaks and dips across the year.
- Interactive table: filter all metrics by year, country and channel, with conditional formatting and totals.

What’s included?
- Power BI template file (.pbit), ready to use
- Sample sales dataset (CSV), so you can test the dashboard immediately
- Custom color theme (.json), to match your brand
- PDF guide with setup and customization steps.
Who this Power BI sales dashboard is for?
Sales Dashboard Power BI is very useful tool for:
- Sales teams that need visual performance tracking
- Freelancers and consultants building client-facing Power BI reports
- Small businesses tracking sales by product, country or channel
- Marketing and operations leads who want clear, actionable sales data
How to use the sales dashboard template?
- Download the .pbit file and open it in Power BI Desktop (free).
- Connect your own sales data, or test with the included sample dataset.
- Adjust filters, titles, colors or metrics to fit your business.
- Publish to Power BI Service or share it in your next sales meeting.
Instant access: you get the download link right after payment.
Frequently asked questions
What is a sales dashboard in Power BI?
Sales Dashboard Power BI is an interactive report that brings your key sales metrics, such as revenue, conversion rate, regions and channels, onto one page, so you can track performance and make decisions quickly.
Do I need to know DAX to use this template?
No. The measures and visuals are already built. You only load your data and adjust filters or titles.
What data do I need?
A sales table with: [your columns, e.g. date, country, channel, product, units sold, sales amount, conversions]. Use the sample CSV as the format guide.
Does it work with Excel or CSV data?
Yes. Power BI Desktop can load Excel and CSV files, and the template comes with a sample CSV to follow.
Can I change the colors to match my brand?
Yes. Import the included .json theme, or edit it with your own brand colors.
Need it set up for your own data?
I can connect your data and customize the dashboard for you. See the setup service.
Reviews
There are no reviews yet.