Sales Dashboard Power BI
Visualize the insights. Understand your conversions. Make data-backed decisions with ease.
What is inside Sales Dashboard in Power BI?
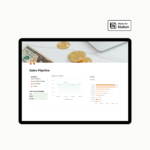
The Sales Dashboard is a pre-built Power BI template crafted for professionals, sales teams, analysts, and business owners who need to monitor sales activity, compare channels, and understand trends at a glance. This template delivers actionable insights with no DAX or design needed.

Main features of Sales Dashboard:
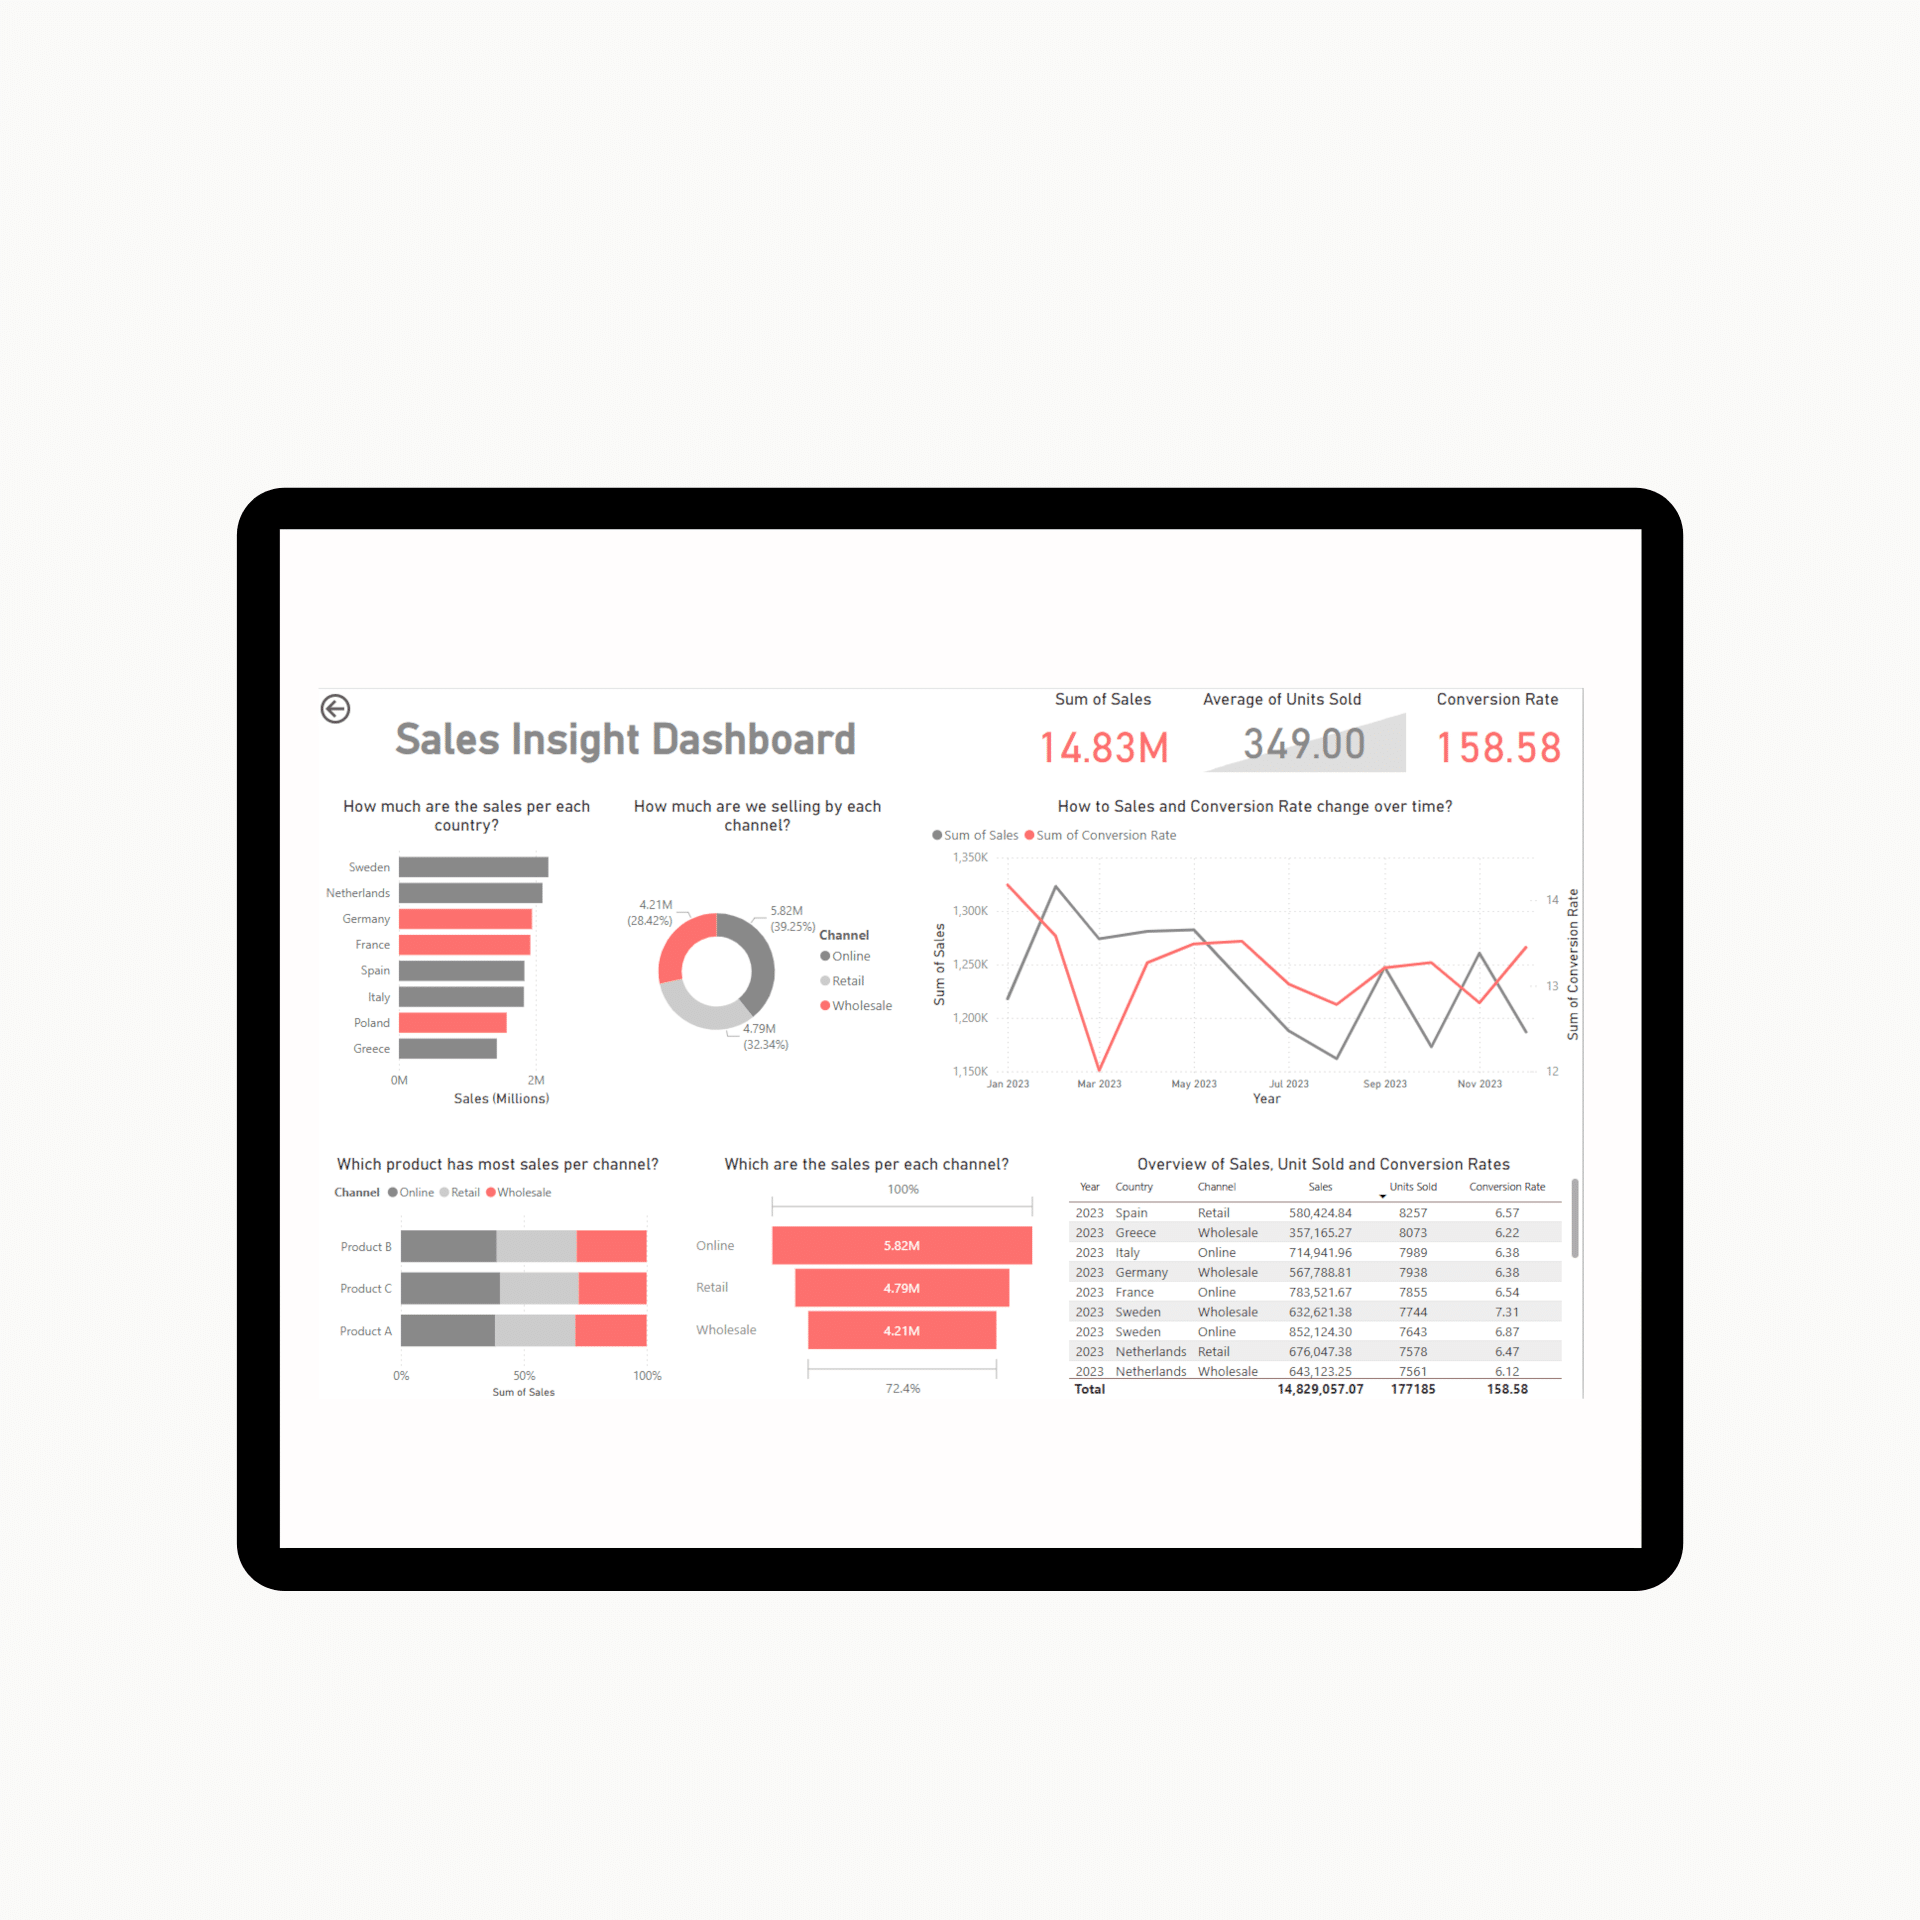
- Executive Overview at a Glance: See total sales, average units sold, and conversion rate all in one place. Clean KPI cards with bold visuals for quick decision-making.
- Regional Sales Breakdown: Bar chart highlighting how much each country contributes. Instantly see top performers like Germany, Sweden, or the Netherlands.
- Channel Distribution: Beautiful donut and stacked bar visuals to show performance by Online, Retail, and Wholesale. Compare which products sell best through each channel.
- Monthly Trends: Line chart comparing sales and conversion rate over time. Quickly spot dips or peaks in performance across the year.
- Interactive Table View: Filterable data table showing all metrics by year, country, and channel. Conditional formatting and totals at the bottom for clean summaries.
What includes the deliver?
- The .pbit Power BI template file (ready to use)
- Sample dataset (CSV) so you can test the dashboard immediately
- The .json file to custom color theme for brand consistency.
- PDF Instructions with setup and customization tips
Who is this template for?
- Sales teams needing visual performance tracking.
- Freelancers or consultants building client-facing dashboards.
- Small businesses tracking product or channel-based sales.
- Marketing and operations leads wanting clear, actionable data.
How to use Sales Dashboard Power BI template?
- Download the .pbit file and open it in Power BI Desktop.
- Load your own dataset (or test with the included sample)
- Customize filters, titles, or metrics as needed
- Present it in the business meeting and impress your boss.



Reviews
There are no reviews yet.